Technical Analysis from A to Z
by Steven B. Achelis
OVERBOUGHT/OVERSOLD
Overview
The Overbought/Oversold ("OB/OS") indicator is a market breadth indicator based on the smoothed difference between advancing and declining issues.
Interpretation
The OB/OS indicator shows when the stock market is overbought (and a correction is due) and when it is oversold (and a rally is due).
Readings above +200 are generally considered bearish and readings below -200 are generally considered bullish. When the OB/OS indicator falls below +200 a sell signal is generated. Similarly, a buy signal is generated when the OB/OS indicator rises above -200.
As with all OB/OS-type indicators, extreme readings may be a sign of a change in investor expectations and may not be followed by the expected correction. (Refer to the discussion on the Advance/Decline Ratio, and the McClellan Oscillator, for additional comments on extremely overbought/oversold conditions.)
Example
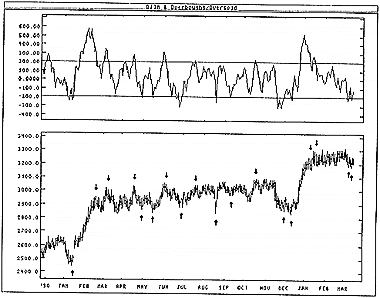
The following chart shows the DJIA and the Overbought/Oversold indicator.

I drew "buy" and "sell" arrows when the indicator penetrated the +200/-200 levels. The OB/OS indicator works very well in this type of trading-range market.
Calculation
The Overbought/Oversold indicator is a 10-period exponential moving average of the difference between the number of advancing and declining issues.
![]()
Contents
- Preface
- Acknowledgments
- Terminology
- To Learn More
- Bibliography
- About the Author
- Technical Analysis
- Price Fields
- Charts
- Support & Resistance
- Trends
- Moving Averages
- Indicators
- Market Indicators
- Line Studies
- Periodicity
- The Time Element
- Conclusion
- Absolute Breadth Index
- Accumulation/Distribution
- Accumulation Swing Index
- Advance/Decline Line
- Advance/Decline Ratio
- Advancing-Declining Issues
- Advancing, Declining, Unchanged Volume
- Andrews' Pitchfork
- Arms Index
- Average True Range
- Bollinger Bands
- Breadth Thrust
- Bull/Bear Ratio
- Candlesticks - Japanese
- CANSLIM
- Chaikin Oscillator
- Commodity Channel Index
- Commodity Selection Index
- Correlation Analysis
- Cumulative Volume Index
- Cycles
- Demand Index
- Detrended Price Oscillator
- Directional Movement
- Dow Theory
- Ease of Movement
- Efficient Market Theory
- Elliott Wave Theory
- Envelopes (Trading Bands)
- Equivolume/Candlevolume
- Fibonacci Studies
- Four Percent Model
- Fourier Transform
- Fundamental Analysis
- Gann Angles
- Herrick Payoff Index
- Interest Rates
- Kagi
- Large Block Ratio
- Linear Regression Lines
- MACD
- Mass Index
- McClellan Oscillator
- McClellan Summation Index
- Median Price
- Member Short Ratio
- Momentum
- Money Flow Index
- Moving Averages
- Negative Volume Index
- New Highs-Lows Cumulative
- New Highs-New Lows
- New Highs/Lows Ratio
- Odd Lot Balance Index
- Odd Lot Purchases/Sales
- Odd Lot Short Ratio
- On Balance Volume
- Open Interest
- Open-10 TRIN
- Option Analysis
- Overbought/Oversold
- Parabolic SAR
- Patterns
- Percent Retracement
- Performance
- Point & Figure
- Positive Volume Index
- Price and Volume Trend
- Price Oscillator
- Price Rate-of-Change
- Public Short Ratio
- Puts/Calls Ratio
- Quadrant Lines
- Relative Strength, Comparative
- Relative Strength Index
- Renko
- Speed Resistance Lines
- Spreads
- Standard Deviation
- STIX
- Stochastic Oscillator
- Swing Index
- Three Line Break
- Time Series Forcast
- Tirone Levels
- Total Short Ratio
- Trade Volume Index
- Trendlines
- TRIX
- Typical Price
- Ultimate Oscillator
- Upside/Downside Ratio
- Upside/Downside Volume
- Vertical Horizonal Filter
- Volatility, Chaikin's
- Volume
- Volume Oscillator
- Volume Rate-of-Change
- Weighted Close
- Williams' Accumulation/Distribution
- Williams' %R
- Zig Zag