Technical Analysis from A to Z
by Steven B. Achelis
ANDREWS' PITCHFORK
Overview
Andrews' Pitchfork is a line study consisting of three parallel trendlines based on three points you select. This tool was developed by Dr. Alan Andrews.
Interpretation
The interpretation of a pitchfork is based on normal trendline support and resistance principles.
Example
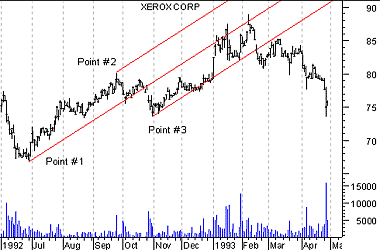
The following chart of Xerox shows an Andrews' Pitchfork.

The pitchfork was displayed by selecting the three points shown. You can see how prices tended to "walk along" the trendlines.
Calculation
The first trendline begins at the left-most point selected (either a major peak or trough) and is drawn so it passes directly between the two right-most points. This line is the "handle" of the pitchfork. The second and third trendlines are then drawn beginning at the two right-most points (a major peak and a major trough) and are drawn parallel to the first line. These lines are the "tines" of the pitchfork.
Contents
- Preface
- Acknowledgments
- Terminology
- To Learn More
- Bibliography
- About the Author
- Technical Analysis
- Price Fields
- Charts
- Support & Resistance
- Trends
- Moving Averages
- Indicators
- Market Indicators
- Line Studies
- Periodicity
- The Time Element
- Conclusion
- Absolute Breadth Index
- Accumulation/Distribution
- Accumulation Swing Index
- Advance/Decline Line
- Advance/Decline Ratio
- Advancing-Declining Issues
- Advancing, Declining, Unchanged Volume
- Andrews' Pitchfork
- Arms Index
- Average True Range
- Bollinger Bands
- Breadth Thrust
- Bull/Bear Ratio
- Candlesticks - Japanese
- CANSLIM
- Chaikin Oscillator
- Commodity Channel Index
- Commodity Selection Index
- Correlation Analysis
- Cumulative Volume Index
- Cycles
- Demand Index
- Detrended Price Oscillator
- Directional Movement
- Dow Theory
- Ease of Movement
- Efficient Market Theory
- Elliott Wave Theory
- Envelopes (Trading Bands)
- Equivolume/Candlevolume
- Fibonacci Studies
- Four Percent Model
- Fourier Transform
- Fundamental Analysis
- Gann Angles
- Herrick Payoff Index
- Interest Rates
- Kagi
- Large Block Ratio
- Linear Regression Lines
- MACD
- Mass Index
- McClellan Oscillator
- McClellan Summation Index
- Median Price
- Member Short Ratio
- Momentum
- Money Flow Index
- Moving Averages
- Negative Volume Index
- New Highs-Lows Cumulative
- New Highs-New Lows
- New Highs/Lows Ratio
- Odd Lot Balance Index
- Odd Lot Purchases/Sales
- Odd Lot Short Ratio
- On Balance Volume
- Open Interest
- Open-10 TRIN
- Option Analysis
- Overbought/Oversold
- Parabolic SAR
- Patterns
- Percent Retracement
- Performance
- Point & Figure
- Positive Volume Index
- Price and Volume Trend
- Price Oscillator
- Price Rate-of-Change
- Public Short Ratio
- Puts/Calls Ratio
- Quadrant Lines
- Relative Strength, Comparative
- Relative Strength Index
- Renko
- Speed Resistance Lines
- Spreads
- Standard Deviation
- STIX
- Stochastic Oscillator
- Swing Index
- Three Line Break
- Time Series Forcast
- Tirone Levels
- Total Short Ratio
- Trade Volume Index
- Trendlines
- TRIX
- Typical Price
- Ultimate Oscillator
- Upside/Downside Ratio
- Upside/Downside Volume
- Vertical Horizonal Filter
- Volatility, Chaikin's
- Volume
- Volume Oscillator
- Volume Rate-of-Change
- Weighted Close
- Williams' Accumulation/Distribution
- Williams' %R
- Zig Zag