Technical Analysis from A to Z
by Steven B. Achelis
STOCHASTIC OSCILLATOR
Overview
Sto.chas.tic (sto kas'tik) adj. 2. Math. designating a process having an infinite progression of jointly distributed random variables.
- Webster's New World Dictionary
The Stochastic Oscillator compares where a security's price closed relative to its price range over a given time period.
Interpretation
The Stochastic Oscillator is displayed as two lines. The main line is called "%K." The second line, called "%D," is a moving average of %K. The %K line is usually displayed as a solid line and the %D line is usually displayed as a dotted line.
There are several ways to interpret a Stochastic Oscillator. Three popular methods include:
- Buy when the Oscillator (either %K or %D) falls below a specific level (e.g., 20) and then rises above that level. Sell when the Oscillator rises above a specific level (e.g., 80) and then falls below that level.
- Buy when the %K line rises above the %D line and sell when the %K line falls below the %D line.
Look for divergences. For example, where prices are making a series of new highs and the Stochastic Oscillator is failing to surpass its previous highs.
Example
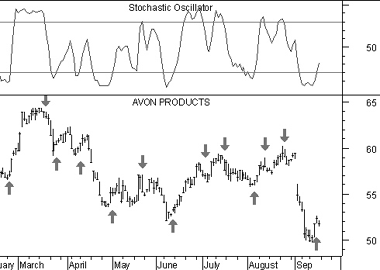
The following chart shows Avon Products and its 10-day Stochastic.

I drew "buy" arrows when the %K line fell below, and then rose above, the level of 20. Similarly, I drew "sell" arrows when the %K line rose above, and then fell below, the level of 80.
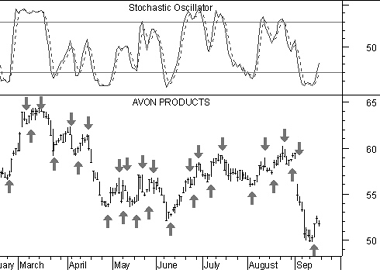
This next chart also shows Avon Products.

In this example I drew "buy" arrows each time the %K line rose above the %D (dotted). Similarly, "sell" arrows were drawn when the %K line fell below the %D line.
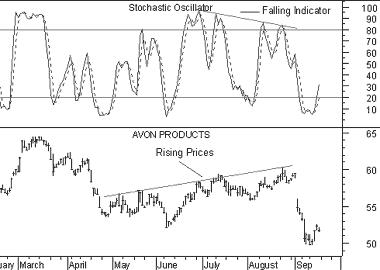
This final chart shows a divergence between the Stochastic Oscillator and prices.

This is a classic divergence where prices are headed higher, but the underlying indicator (the Stochastic Oscillator) is moving lower. When a divergence occurs between an indicator and prices, the indicator typically provides the clue as to where prices will head.
Calculation
The Stochastic Oscillator has four variables:
- %K Periods.
This is the number of time periods used in the stochastic calculation.
- %K Slowing Periods.
This value controls the internal smoothing of %K. A value of 1 is considered a fast stochastic; a value of 3 is considered a slow stochastic.
- %D Periods.
This is the number of time periods used when calculating a moving average of %K. The moving average is called "%D" and is usually displayed as a dotted line on top of %K.
- %D Method.
The method (i.e., Exponential, Simple, Time Series, Triangular, Variable, or Weighted) that is used to calculate %D.
The formula for %K is:
![]()
For example, to calculate a 10-day %K, first find the security's highest-high and lowest-low over the last 10 days. As an example, let's assume that during the last 10 days the highest-high was 46 and the lowest-low was 38--a range of 8 points. If today's closing price was 41, %K would be calculated as:
![]()
The 37.5% in this example shows that today's close was at the level of 37.5% relative to the security's trading range over the last 10 days. If today's close was 42, the Stochastic Oscillator would be 50%. This would mean that that the security closed today at 50%, or the mid-point, of its 10-day trading range.
The above example used a %K Slowing Period of 1-day (no slowing). If you use a value greater than one, you average the highest-high and the lowest-low over the number of %K Slowing Periods before performing the division.
A moving average of %K is then calculated using the number of time periods specified in the %D Periods. This moving average is called %D.
The Stochastic Oscillator always ranges between 0% and 100%. A reading of 0% shows that the security's close was the lowest price that the security has traded during the preceding x-time periods. A reading of 100% shows that the security's close was the highest price that the security has traded during the preceding x-time periods.
Contents
- Preface
- Acknowledgments
- Terminology
- To Learn More
- Bibliography
- About the Author
- Technical Analysis
- Price Fields
- Charts
- Support & Resistance
- Trends
- Moving Averages
- Indicators
- Market Indicators
- Line Studies
- Periodicity
- The Time Element
- Conclusion
- Absolute Breadth Index
- Accumulation/Distribution
- Accumulation Swing Index
- Advance/Decline Line
- Advance/Decline Ratio
- Advancing-Declining Issues
- Advancing, Declining, Unchanged Volume
- Andrews' Pitchfork
- Arms Index
- Average True Range
- Bollinger Bands
- Breadth Thrust
- Bull/Bear Ratio
- Candlesticks - Japanese
- CANSLIM
- Chaikin Oscillator
- Commodity Channel Index
- Commodity Selection Index
- Correlation Analysis
- Cumulative Volume Index
- Cycles
- Demand Index
- Detrended Price Oscillator
- Directional Movement
- Dow Theory
- Ease of Movement
- Efficient Market Theory
- Elliott Wave Theory
- Envelopes (Trading Bands)
- Equivolume/Candlevolume
- Fibonacci Studies
- Four Percent Model
- Fourier Transform
- Fundamental Analysis
- Gann Angles
- Herrick Payoff Index
- Interest Rates
- Kagi
- Large Block Ratio
- Linear Regression Lines
- MACD
- Mass Index
- McClellan Oscillator
- McClellan Summation Index
- Median Price
- Member Short Ratio
- Momentum
- Money Flow Index
- Moving Averages
- Negative Volume Index
- New Highs-Lows Cumulative
- New Highs-New Lows
- New Highs/Lows Ratio
- Odd Lot Balance Index
- Odd Lot Purchases/Sales
- Odd Lot Short Ratio
- On Balance Volume
- Open Interest
- Open-10 TRIN
- Option Analysis
- Overbought/Oversold
- Parabolic SAR
- Patterns
- Percent Retracement
- Performance
- Point & Figure
- Positive Volume Index
- Price and Volume Trend
- Price Oscillator
- Price Rate-of-Change
- Public Short Ratio
- Puts/Calls Ratio
- Quadrant Lines
- Relative Strength, Comparative
- Relative Strength Index
- Renko
- Speed Resistance Lines
- Spreads
- Standard Deviation
- STIX
- Stochastic Oscillator
- Swing Index
- Three Line Break
- Time Series Forcast
- Tirone Levels
- Total Short Ratio
- Trade Volume Index
- Trendlines
- TRIX
- Typical Price
- Ultimate Oscillator
- Upside/Downside Ratio
- Upside/Downside Volume
- Vertical Horizonal Filter
- Volatility, Chaikin's
- Volume
- Volume Oscillator
- Volume Rate-of-Change
- Weighted Close
- Williams' Accumulation/Distribution
- Williams' %R
- Zig Zag