Technical Analysis from A to Z
by Steven B. Achelis
HERRICK PAYOFF INDEX
Overview
The Herrick Payoff Index is designed to show the amount of money flowing into or out of a futures contract. The Index uses open interest during its calculations, therefore, the security being analyzed must contain open interest.
The Herrick Payoff Index was developed by John Herrick.
Interpretation
When the Herrick Payoff Index is above zero, it shows that money is flowing into the futures contract (which is bullish). When the Index is below zero, it shows that money is flowing out of the futures contract (which is bearish).
The interpretation of the Herrick Payoff Index involves looking for divergences between the Index and prices.
Example
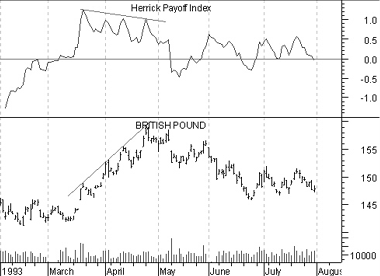
The following chart shows the British Pound and the Herrick Payoff Index.

The trendlines identify a bearish divergence where prices were making new highs while the Payoff Index was failing to make new highs. As is typical with divergences, prices corrected to confirm the indicator.
Calculation
The Herrick Payoff Index requires two inputs, a smoothing factor known as the "multiplying factor" and the "value of a one cent move."
The multiplying factor is part of a smoothing mechanism. The results are similar to the smoothing obtained by a moving average. For example, a multiplying factor of ten produces results similar to a 10-period moving average.
Mr. Herrick recommends 100 as "the value of a one cent move" for all commodities except silver, which should be 50.
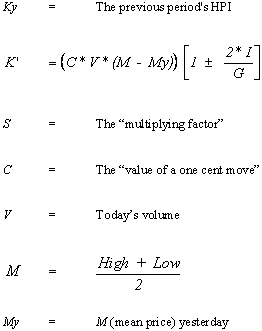
The calculation of the Herrick Payoff Index ("HPI") is:
![]()
Where:


Contents
- Preface
- Acknowledgments
- Terminology
- To Learn More
- Bibliography
- About the Author
- Technical Analysis
- Price Fields
- Charts
- Support & Resistance
- Trends
- Moving Averages
- Indicators
- Market Indicators
- Line Studies
- Periodicity
- The Time Element
- Conclusion
- Absolute Breadth Index
- Accumulation/Distribution
- Accumulation Swing Index
- Advance/Decline Line
- Advance/Decline Ratio
- Advancing-Declining Issues
- Advancing, Declining, Unchanged Volume
- Andrews' Pitchfork
- Arms Index
- Average True Range
- Bollinger Bands
- Breadth Thrust
- Bull/Bear Ratio
- Candlesticks - Japanese
- CANSLIM
- Chaikin Oscillator
- Commodity Channel Index
- Commodity Selection Index
- Correlation Analysis
- Cumulative Volume Index
- Cycles
- Demand Index
- Detrended Price Oscillator
- Directional Movement
- Dow Theory
- Ease of Movement
- Efficient Market Theory
- Elliott Wave Theory
- Envelopes (Trading Bands)
- Equivolume/Candlevolume
- Fibonacci Studies
- Four Percent Model
- Fourier Transform
- Fundamental Analysis
- Gann Angles
- Herrick Payoff Index
- Interest Rates
- Kagi
- Large Block Ratio
- Linear Regression Lines
- MACD
- Mass Index
- McClellan Oscillator
- McClellan Summation Index
- Median Price
- Member Short Ratio
- Momentum
- Money Flow Index
- Moving Averages
- Negative Volume Index
- New Highs-Lows Cumulative
- New Highs-New Lows
- New Highs/Lows Ratio
- Odd Lot Balance Index
- Odd Lot Purchases/Sales
- Odd Lot Short Ratio
- On Balance Volume
- Open Interest
- Open-10 TRIN
- Option Analysis
- Overbought/Oversold
- Parabolic SAR
- Patterns
- Percent Retracement
- Performance
- Point & Figure
- Positive Volume Index
- Price and Volume Trend
- Price Oscillator
- Price Rate-of-Change
- Public Short Ratio
- Puts/Calls Ratio
- Quadrant Lines
- Relative Strength, Comparative
- Relative Strength Index
- Renko
- Speed Resistance Lines
- Spreads
- Standard Deviation
- STIX
- Stochastic Oscillator
- Swing Index
- Three Line Break
- Time Series Forcast
- Tirone Levels
- Total Short Ratio
- Trade Volume Index
- Trendlines
- TRIX
- Typical Price
- Ultimate Oscillator
- Upside/Downside Ratio
- Upside/Downside Volume
- Vertical Horizonal Filter
- Volatility, Chaikin's
- Volume
- Volume Oscillator
- Volume Rate-of-Change
- Weighted Close
- Williams' Accumulation/Distribution
- Williams' %R
- Zig Zag