Technical Analysis from A to Z
by Steven B. Achelis
MOMENTUM
Overview
The Momentum indicator measures the amount that a security's price has changed over a given time span.
Interpretation
The interpretation of the Momentum indicator is identical to the interpretation of the Price ROC. Both indicators display the rate-of-change of a security's price. However, the Price ROC indicator displays the rate-of-change as a percentage whereas the Momentum indicator displays the rate-of-change as a ratio.
There are basically two ways to use the Momentum indicator:
- You can use the Momentum indicator as a trend-following oscillator similar to the MACD (this is the method I prefer). Buy when the indicator bottoms and turns up and sell when the indicator peaks and turns down. You may want to plot a short-term (e.g., 9-period) moving average of the indicator to determine when it is bottoming or peaking.
If the Momentum indicator reaches extremely high or low values (relative to its historical values), you should assume a continuation of the current trend. For example, if the Momentum indicator reaches extremely high values and then turns down, you should assume prices will probably go still higher. In either case, only trade after prices confirm the signal generated by the indicator (e.g., if prices peak and turn down, wait for prices to begin to fall before selling).
- You can also use the Momentum indicator as a leading indicator. This method assumes that market tops are typically identified by a rapid price increase (when everyone expects prices to go higher) and that market bottoms typically end with rapid price declines (when everyone wants to get out). This is often the case, but it is also a broad generalization.
As a market peaks, the Momentum indicator will climb sharply and then fall off-- diverging from the continued upward or sideways movement of the price. Similarly, at a market bottom, Momentum will drop sharply and then begin to climb well ahead of prices. Both of these situations result in divergences between the indicator and prices.
Example
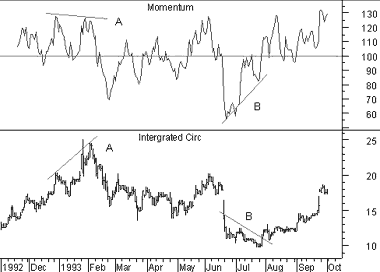
The following chart shows Integrated Circuits and its 12-day Momentum indicator.

Divergences at points "A" and "B" provided leading indications of the reversals that followed.
This online edition of Technical Analysis from A to Z is reproduced here with permission from the author and publisher.
Contents
- Preface
- Acknowledgments
- Terminology
- To Learn More
- Bibliography
- About the Author
- Technical Analysis
- Price Fields
- Charts
- Support & Resistance
- Trends
- Moving Averages
- Indicators
- Market Indicators
- Line Studies
- Periodicity
- The Time Element
- Conclusion
- Absolute Breadth Index
- Accumulation/Distribution
- Accumulation Swing Index
- Advance/Decline Line
- Advance/Decline Ratio
- Advancing-Declining Issues
- Advancing, Declining, Unchanged Volume
- Andrews' Pitchfork
- Arms Index
- Average True Range
- Bollinger Bands
- Breadth Thrust
- Bull/Bear Ratio
- Candlesticks - Japanese
- CANSLIM
- Chaikin Oscillator
- Commodity Channel Index
- Commodity Selection Index
- Correlation Analysis
- Cumulative Volume Index
- Cycles
- Demand Index
- Detrended Price Oscillator
- Directional Movement
- Dow Theory
- Ease of Movement
- Efficient Market Theory
- Elliott Wave Theory
- Envelopes (Trading Bands)
- Equivolume/Candlevolume
- Fibonacci Studies
- Four Percent Model
- Fourier Transform
- Fundamental Analysis
- Gann Angles
- Herrick Payoff Index
- Interest Rates
- Kagi
- Large Block Ratio
- Linear Regression Lines
- MACD
- Mass Index
- McClellan Oscillator
- McClellan Summation Index
- Median Price
- Member Short Ratio
- Momentum
- Money Flow Index
- Moving Averages
- Negative Volume Index
- New Highs-Lows Cumulative
- New Highs-New Lows
- New Highs/Lows Ratio
- Odd Lot Balance Index
- Odd Lot Purchases/Sales
- Odd Lot Short Ratio
- On Balance Volume
- Open Interest
- Open-10 TRIN
- Option Analysis
- Overbought/Oversold
- Parabolic SAR
- Patterns
- Percent Retracement
- Performance
- Point & Figure
- Positive Volume Index
- Price and Volume Trend
- Price Oscillator
- Price Rate-of-Change
- Public Short Ratio
- Puts/Calls Ratio
- Quadrant Lines
- Relative Strength, Comparative
- Relative Strength Index
- Renko
- Speed Resistance Lines
- Spreads
- Standard Deviation
- STIX
- Stochastic Oscillator
- Swing Index
- Three Line Break
- Time Series Forcast
- Tirone Levels
- Total Short Ratio
- Trade Volume Index
- Trendlines
- TRIX
- Typical Price
- Ultimate Oscillator
- Upside/Downside Ratio
- Upside/Downside Volume
- Vertical Horizonal Filter
- Volatility, Chaikin's
- Volume
- Volume Oscillator
- Volume Rate-of-Change
- Weighted Close
- Williams' Accumulation/Distribution
- Williams' %R
- Zig Zag