Technical Analysis from A to Z
by Steven B. Achelis
COMMODITY CHANNEL INDEX
Overview
The Commodity Channel Index ("CCI") measures the variation of a security's price from its statistical mean. High values show that prices are unusually high compared to average prices whereas low values indicate that prices are unusually low. Contrary to its name, the CCI can be used effectively on any type of security, not just commodities.
The CCI was developed by Donald Lambert.
Interpretation
There are two basic methods of interpreting the CCI: looking for divergences and as an overbought/oversold indicator.
- A divergence occurs when the security's prices are making new highs while the CCI is failing to surpass its previous highs. This classic divergence is usually followed by a correction in the security's price.
- The CCI typically oscillates between '100. To use the CCI as an overbought/oversold indicator, readings above +100 imply an overbought condition (and a pending price correction) while readings below -100 imply an oversold condition (and a pending rally).
Example
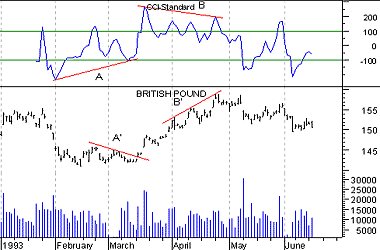
The following chart shows the British Pound and its 14-day CCI. A bullish divergence occurred at point "A" (prices were declining as the CCI was advancing). Prices subsequently rallied. A bearish divergence occurred at point "B" (prices were advancing while the CCI was declining). Prices corrected. Note too, that each of these divergences occurred at extreme levels (i.e., above +100 or below -100) making them even more significant.

Calculation
A complete explanation of the CCI calculation is beyond the scope of this book. The following are basic steps involved in the calculation:
- Add each period's high, low, and close and divide this sum by 3. This is the typical price.
- Calculate an n-period simple moving average of the typical prices computed in Step 1.
- For each of the prior n-periods, subtract today's Step 2 value from Step 1's value n days ago. For example, if you were calculating a 5-day CCI, you would perform five subtractions using today's Step 2 value.
- Calculate an n-period simple moving average of the absolute values of each of the results in Step 3.
- Multiply the value in Step 4 by 0.015.
- Subtract the value from Step 2 from the value in Step 1.
- Divide the value in Step 6 by the value in Step 5.
Further details on the contents and interpretation of the CCI can be found in an article by Donald Lambert that appeared in the October 1980 issue of Commodities (now known as Futures) Magazine.
Contents
- Preface
- Acknowledgments
- Terminology
- To Learn More
- Bibliography
- About the Author
- Technical Analysis
- Price Fields
- Charts
- Support & Resistance
- Trends
- Moving Averages
- Indicators
- Market Indicators
- Line Studies
- Periodicity
- The Time Element
- Conclusion
- Absolute Breadth Index
- Accumulation/Distribution
- Accumulation Swing Index
- Advance/Decline Line
- Advance/Decline Ratio
- Advancing-Declining Issues
- Advancing, Declining, Unchanged Volume
- Andrews' Pitchfork
- Arms Index
- Average True Range
- Bollinger Bands
- Breadth Thrust
- Bull/Bear Ratio
- Candlesticks - Japanese
- CANSLIM
- Chaikin Oscillator
- Commodity Channel Index
- Commodity Selection Index
- Correlation Analysis
- Cumulative Volume Index
- Cycles
- Demand Index
- Detrended Price Oscillator
- Directional Movement
- Dow Theory
- Ease of Movement
- Efficient Market Theory
- Elliott Wave Theory
- Envelopes (Trading Bands)
- Equivolume/Candlevolume
- Fibonacci Studies
- Four Percent Model
- Fourier Transform
- Fundamental Analysis
- Gann Angles
- Herrick Payoff Index
- Interest Rates
- Kagi
- Large Block Ratio
- Linear Regression Lines
- MACD
- Mass Index
- McClellan Oscillator
- McClellan Summation Index
- Median Price
- Member Short Ratio
- Momentum
- Money Flow Index
- Moving Averages
- Negative Volume Index
- New Highs-Lows Cumulative
- New Highs-New Lows
- New Highs/Lows Ratio
- Odd Lot Balance Index
- Odd Lot Purchases/Sales
- Odd Lot Short Ratio
- On Balance Volume
- Open Interest
- Open-10 TRIN
- Option Analysis
- Overbought/Oversold
- Parabolic SAR
- Patterns
- Percent Retracement
- Performance
- Point & Figure
- Positive Volume Index
- Price and Volume Trend
- Price Oscillator
- Price Rate-of-Change
- Public Short Ratio
- Puts/Calls Ratio
- Quadrant Lines
- Relative Strength, Comparative
- Relative Strength Index
- Renko
- Speed Resistance Lines
- Spreads
- Standard Deviation
- STIX
- Stochastic Oscillator
- Swing Index
- Three Line Break
- Time Series Forcast
- Tirone Levels
- Total Short Ratio
- Trade Volume Index
- Trendlines
- TRIX
- Typical Price
- Ultimate Oscillator
- Upside/Downside Ratio
- Upside/Downside Volume
- Vertical Horizonal Filter
- Volatility, Chaikin's
- Volume
- Volume Oscillator
- Volume Rate-of-Change
- Weighted Close
- Williams' Accumulation/Distribution
- Williams' %R
- Zig Zag