Technical Analysis from A to Z
by Steven B. Achelis
VOLUME OSCILLATOR
Overview
The Volume Oscillator displays the difference between two moving averages of a security's volume. The difference between the moving averages can be expressed in either points or percentages.
Interpretation
You can use the difference between two moving averages of volume to determine if the overall volume trend is increasing or decreasing. When the Volume Oscillator rises above zero, it signifies that the shorter-term volume moving average has risen above the longer-term volume moving average, and thus, that the short-term volume trend is higher (i.e., more volume) than the longer-term volume trend.
There are many ways to interpret changes in volume trends. One common belief is that rising prices coupled with increased volume, and falling prices coupled with decreased volume, is bullish. Conversely, if volume increases when prices fall, and volume decreases when prices rise, the market is showing signs of underlying weakness.
The theory behind this is straight forward. Rising prices coupled with increased volume signifies increased upside participation (more buyers) that should lead to a continued move. Conversely, falling prices coupled with increased volume (more sellers) signifies decreased upside participation.
Example
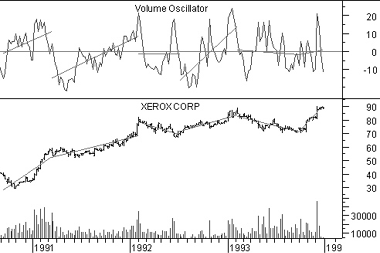
The following chart shows Xerox and 5/10-week Volume Oscillator.

I drew linear regression trendlines on both the prices and the Volume Oscillator.
This chart shows a healthy pattern. When prices were moving higher, as shown by rising linear regression trendlines, the Volume Oscillator was also rising. When prices were falling, the Volume Oscillator was also falling.
Calculation
The Volume Oscillator can display the difference between the two moving averages as either points or percentages. To see the difference in points, subtract the longer-term moving average of volume from the shorter-term moving average of volume:
![]()
To display the difference between the moving averages in percentages, divide the difference between the two moving averages by the shorter-term moving average:
![]()
Contents
- Preface
- Acknowledgments
- Terminology
- To Learn More
- Bibliography
- About the Author
- Technical Analysis
- Price Fields
- Charts
- Support & Resistance
- Trends
- Moving Averages
- Indicators
- Market Indicators
- Line Studies
- Periodicity
- The Time Element
- Conclusion
- Absolute Breadth Index
- Accumulation/Distribution
- Accumulation Swing Index
- Advance/Decline Line
- Advance/Decline Ratio
- Advancing-Declining Issues
- Advancing, Declining, Unchanged Volume
- Andrews' Pitchfork
- Arms Index
- Average True Range
- Bollinger Bands
- Breadth Thrust
- Bull/Bear Ratio
- Candlesticks - Japanese
- CANSLIM
- Chaikin Oscillator
- Commodity Channel Index
- Commodity Selection Index
- Correlation Analysis
- Cumulative Volume Index
- Cycles
- Demand Index
- Detrended Price Oscillator
- Directional Movement
- Dow Theory
- Ease of Movement
- Efficient Market Theory
- Elliott Wave Theory
- Envelopes (Trading Bands)
- Equivolume/Candlevolume
- Fibonacci Studies
- Four Percent Model
- Fourier Transform
- Fundamental Analysis
- Gann Angles
- Herrick Payoff Index
- Interest Rates
- Kagi
- Large Block Ratio
- Linear Regression Lines
- MACD
- Mass Index
- McClellan Oscillator
- McClellan Summation Index
- Median Price
- Member Short Ratio
- Momentum
- Money Flow Index
- Moving Averages
- Negative Volume Index
- New Highs-Lows Cumulative
- New Highs-New Lows
- New Highs/Lows Ratio
- Odd Lot Balance Index
- Odd Lot Purchases/Sales
- Odd Lot Short Ratio
- On Balance Volume
- Open Interest
- Open-10 TRIN
- Option Analysis
- Overbought/Oversold
- Parabolic SAR
- Patterns
- Percent Retracement
- Performance
- Point & Figure
- Positive Volume Index
- Price and Volume Trend
- Price Oscillator
- Price Rate-of-Change
- Public Short Ratio
- Puts/Calls Ratio
- Quadrant Lines
- Relative Strength, Comparative
- Relative Strength Index
- Renko
- Speed Resistance Lines
- Spreads
- Standard Deviation
- STIX
- Stochastic Oscillator
- Swing Index
- Three Line Break
- Time Series Forcast
- Tirone Levels
- Total Short Ratio
- Trade Volume Index
- Trendlines
- TRIX
- Typical Price
- Ultimate Oscillator
- Upside/Downside Ratio
- Upside/Downside Volume
- Vertical Horizonal Filter
- Volatility, Chaikin's
- Volume
- Volume Oscillator
- Volume Rate-of-Change
- Weighted Close
- Williams' Accumulation/Distribution
- Williams' %R
- Zig Zag